- échelle fiber fed spectrograph with Atik 460ex CCD camera, now cooled at -10°C (winter)
- C11 telescope; diameter 0.28m and focal 1.74m (f/6)
- Robofocus motorized focuser
- Losmandy Titan mount, guided with Atik Titan CCD camera
- Pulsar 2.7m motorized dome
- PRISM v10 software to control all equipment
Note that this checklist works for high resolution spectra. For lower resolution, more care should be taken on the overall profile and continuum.
Fist, let's look at Halpha. A good thing to do is to compare with spectra available. For variable object, look at ARAS or BeSS databases:
Find a spectrum taken at a close time and compare it, for exemple:

You can also, for hot stars, look for telluric (our own atmosphere) lines as they are fixed and are a very good indicator of the wavelength calibration. In the exemple above, I have plenty of absorption line from the cool star in VV Cep system and comparison with Olivier Garde's echelle spectrum shows a very good match.
With echelle spectra, the overall spectrum is sometimes more difficult as each order have to be merged together and this process is not always perfect. In BeSS, each orders are stored individually.In ARAS database, I put the merged spectrum but make also available a ZIP archive wih all invidividual spectra. Anyway, I also check the overall profile - there is here some differences certainly due to uncorrected air masses differences (observers at different latitude) but I considere this within acceptable limits:

For several weeks now, I am monitoring my exposures on Be stars spectra and measure the Signal to Noise Ratio (SNR) on the continuum near Halpha spectral line. This is a good indication of the sky transparency & seeing.
I use ISIS to measure the SNR. On Be stars I just take a continuum near Halpha. I always use SNR(2) value in the FWHM measurement tool provided by ISIS:

For cooler star, I reduce two individual spectra and divide the profile near Halpha, then measure the SNR as shown here on VV Cep:


Because I am measuring two spectra, I have to divide the SNR by 1.4 (square root of 2) to get the individual exposure SNR; in this exemple SNR(one exposure)=61/1.4=44.
Then, for 7 exposures as I have taken that night, my SNR will be multipled by the square root of 7, ie: SNR(7 exposures)=44*2.6=114.
Here is my monitoring:

For each spectra, I note the individual exposure time, the number of exposures and the count in ADU (intensity levels) of the maximum reach o the spectrum. I have of course to avoid saturation (65k) and usually look for max ADU=40000. I also note the achieved SNR on spectrum after reduction.
Based on this, I first calculate te exposure I should use to reach 40k ADU level (with a maximum of 20 minutes for my setup). I round the result to the 10th. Of course, it varies depending on the night quality, mainly the transparency and seeing conditions.
Exp40k = min [ 1200 ; Exp(s) * 40 / Max_kADU ]
For exemple on 28 Cyg: Exp40k = 600 * 40 / 36 = 670 seconds
Then I calculate the ideal exposure time (rounded to the minute) to reach SNR=100 which is the minimum goal for BeSS Be Star Spectra high resolution Halpha monitoring program.
BestExpMin = Exp(s)*NbExp * (100/SNR2)^2 / 60
For 28 Cyg: BestExpMin = 600 * 3 * (100/108)^2 /60 = 1800 * 0.96 / 60 = 26 minutes
This gives me the rounded number of exposures I should acquire:
Nb/SNR100 = BestExpMin * 60 / Exp40k
For 28 Cyg: Nb/SNR100 = 26 * 60 / 670 = 2.3 = 3 exposures
This monitoring is a good way of tracking the night quality. It is also a great tool to quickly find the individual exposure time and the number of exposures to reach the SNR>100 goal. I used to do short 10s exposure to calculate the individual exposure time and do more than required exposures before. With this tool, I have been able to skip the short exposure and be overall more efficient in my Be star spectra monitoring program.
Here is, in a graph version, the best exposure time to reach SNR=100 per star magnitude:
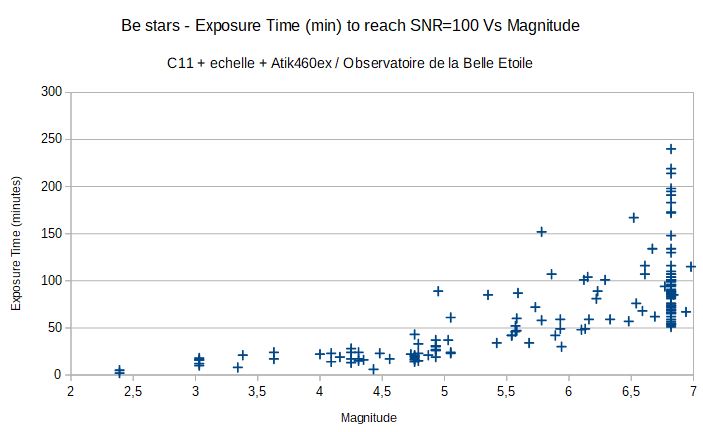
One can see the dispersion between the nights, specially the vertical bar which is V442 Andromedae whom I took lot of spectra recently. Expsure time varies in the range of 50 to 250 minutes depending on night quality.
I encourage you to keep track of your own spectra in order to monitor your quality over time and keep in mind, for Be stars but not only, that the SNR is an important indicator of quality of your spectra, as important for me as the wavelength calibration or instrumental response quality.
Aucun commentaire:
Enregistrer un commentaire