vendredi 6 octobre 2017

Checking spectra quality

It is important, specially at the beginning but also from time to time, to check your spectra quality. Here is a quick checklist of how I do it for my setup:
  • échelle fiber fed spectrograph with Atik 460ex CCD camera, now cooled at -10°C (winter)
  • C11 telescope; diameter 0.28m and focal 1.74m (f/6)
  • Robofocus motorized focuser
  • Losmandy Titan mount, guided with Atik Titan CCD camera
  • Pulsar 2.7m motorized dome
  • PRISM v10 software to control all equipment


Note that this checklist  works for high resolution spectra. For lower resolution, more care should be taken on the overall profile and continuum.


Fist, let's look at Halpha. A good thing to do is to compare with spectra available. For variable object, look at ARAS or BeSS databases:
Find a spectrum taken at a close time and compare it, for exemple:


 You can also, for hot stars, look for telluric (our own atmosphere) lines as they are fixed and are a very good indicator of the wavelength calibration. In the exemple above, I have plenty of absorption line from the cool star in VV Cep system and comparison with Olivier Garde's echelle spectrum shows a very good match.


With echelle spectra, the overall spectrum is sometimes more difficult as each order have to be merged together and this process is not always perfect. In BeSS, each orders are stored individually.In ARAS database, I put the merged spectrum but make also available a ZIP archive wih all invidividual spectra. Anyway, I also check the overall profile - there is here some differences certainly due to uncorrected air masses differences (observers at different latitude) but I considere this within acceptable limits:


For several weeks now, I am monitoring my exposures on Be stars spectra and measure the Signal to Noise Ratio (SNR) on the continuum near Halpha spectral line. This is a good indication of the sky transparency & seeing.

I use ISIS to measure the SNR. On Be stars I just take a continuum near Halpha. I always use SNR(2) value in the FWHM measurement tool provided by ISIS:


For cooler star, I reduce two individual spectra and divide the profile near Halpha, then measure the SNR as shown here on VV Cep:


Because I am measuring two spectra, I have to divide the SNR by 1.4 (square root of 2) to get the individual exposure SNR; in this exemple SNR(one exposure)=61/1.4=44.
Then, for 7 exposures as I have taken that night, my SNR will be multipled by the square root of 7, ie: SNR(7 exposures)=44*2.6=114.

Here is my monitoring:


For each spectra, I note the individual exposure time, the number of exposures and the count in ADU (intensity levels) of the maximum reach o the spectrum. I have of course to avoid saturation (65k) and usually look for max ADU=40000. I also note the achieved SNR on spectrum after reduction.

Based on this, I first calculate te exposure I should use to reach 40k ADU level (with a maximum of 20 minutes for my setup). I round the result to the 10th. Of course, it varies depending on the night quality, mainly the transparency and seeing conditions.

Exp40k =  min [ 1200 ; Exp(s) * 40 / Max_kADU ]

For exemple on 28 Cyg: Exp40k = 600 * 40 / 36 = 670 seconds


Then I calculate the ideal exposure time (rounded to the minute) to reach SNR=100 which is the minimum goal for BeSS Be Star Spectra high resolution Halpha monitoring program.

BestExpMin = Exp(s)*NbExp * (100/SNR2)^2 / 60

For 28 Cyg: BestExpMin = 600 * 3 * (100/108)^2 /60 = 1800 * 0.96 / 60 = 26 minutes


This gives me the rounded number of exposures I should acquire:

Nb/SNR100 = BestExpMin * 60 / Exp40k

For 28 Cyg: Nb/SNR100 = 26 * 60 / 670 = 2.3 = 3 exposures


This monitoring is a good way of tracking the night quality. It is also a great tool to quickly find the individual exposure time and the number of exposures to reach the SNR>100 goal. I used to do short 10s exposure to calculate the individual exposure time and do more than required exposures before. With this tool, I have been able to skip the short exposure and be overall more efficient in my Be star spectra monitoring program.

Here is, in a graph version, the best exposure time to reach SNR=100 per star magnitude:
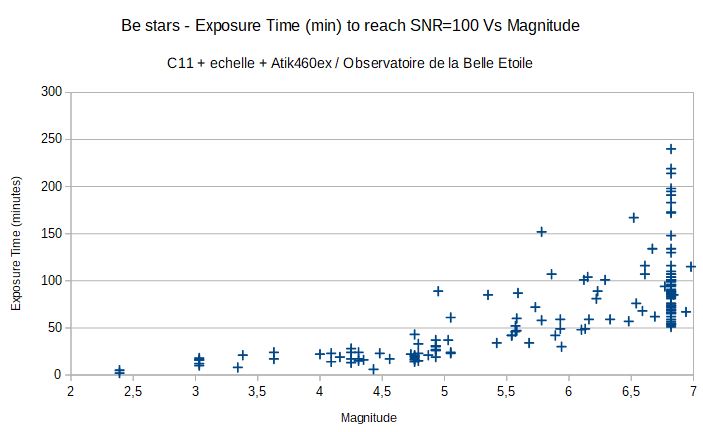

One can see the dispersion between the nights, specially the vertical bar which is V442 Andromedae whom I took lot of spectra recently. Expsure time varies in the range of 50 to 250 minutes depending on night quality.

I encourage you to keep track of your own spectra in order to monitor your quality over time and keep in mind, for Be stars but not only, that the SNR is an important indicator of quality of your spectra, as important for me as the wavelength calibration or instrumental response quality.

Status on V442 And outburst

Couple of days are missing from the monitoring due to weather and not enough geographical coverage. But we still have a nice follow up of the outburst with lower emission level as V+R graph shows but still some variability in the V/R ratio.

144 spectra have been collected by 8 observers for a total of 159 hours of acquisition.

Here are the updated graphs, with one showing the distance (in speed) between the two peaks.

 Fainter Halpha emission now


 Hbeta emission is now gone

 HeI 6678 photospheric line shows a clear 2.6217 days stellar rotation period

Difference between the two peaks


 V+R show a clear decline

V/R variability over time with different "sequences"

V/R seems to show two periods (quick analysis)

dimanche 1 octobre 2017

Several records beaten at Observatory of Belle Etoile

The past few weeks have been very busy at the Observatory of Belle Etoile, with lot of observing hours! And several records have fallen in my history of astronomical observations and spectroscopy.


I/ First,  this third quarter of 2017 (from july to september), I have observed 45 nights for a total of 250 hours. This is my all-time record - and I am recording my observing time for more than 23 years now!

II/ Second, I reached 1334 spectra (58 in Halpha) waiting for validation - well, this is not critical but I kept the BeSS administrators busy! All have been validated now.


III/ Third, I crossed the key 10k milestone for Be stars with now 11391 spectra in BeSS. Just few days after Olivier Garde ("sans rancune", Olivier!) crossed this milestone as well... I am now 3rd in the amateur top observers:


IV/ Fourth, I have acquired 564 spectra in Halpha alone, crossing the 500 milestone and making me entering in the Top 10 of Halpha observers - a first for me. Well, the 5th position is within reach:


V/ Fifth, my observing time since I have the observatory crossed the 500 hours observing time milestone (564 hours actually). 50% of that time is actually acquiring spectra (ie: "photon time"). My best efficient night was the night of september 19th with an efficiency ratio of 87% ("observatory open time" actually acquiring spectra).
Looking at the other 50% time, here is a rough breakdown:
  • 21% technical downtime
  • 12% non spectroscopy time (outreach, visual observation, photometry)
  • 9% opening/closing time
  • 8% download/waiting time (including lost exposure due to clouds or waiting time between two individual exposures)

VI/ Sixth, I reached one millions seconds of total exposure time since I have the observatory in the backyard (1.17 millions seconds actually).

VII/ Seventh, and this is a real improvement for me, I reached three night in a raw observing remotely from home. But I still have sometimes the Atik 460 frezing at the end of an exposure, usually right after the first Thorium-Argon calibration or the first acquisition after calibration is done. It freezes after download and image is not saved; I have to physically remove and reconnect the USB cable to make it work again.I suspect a USB issue but haven't found the problem yet.
Otherwise, my only operations at the observatory are to connect the Atik Titan USB, remove telescope cover & add the anti-dew cover, power ON the Atik 460 camera and the mount at the begining & just the reverse steps at the end. Everything else is done remotely through TeamViewer (including file transfer at the end) and it works great.
An important thing is that I have done a pointing model for the Losmandy Titan mount with about 7-8 stars few weeks ago. Since then, the target is always in the guiding chip for GoTo within 40° and otherwise not very far. Pointing procedure has become very easy. I always point on the same side of the pier so that helps. But still, this is a real improvement on my setup!
Anyway, while I still have some motor lags and need to re-adjust the DEC axis (I think it is too tight), the overall the setup works very well now and I have been able during several nights to successfully take long sleep while acquiring long series of V442 And spectra for exemple.

watching Star Trek documentary during remote observation session

Spectroscopy of Be stars & remote observations rock!

jeudi 21 septembre 2017

V442 And outburst - one month after

Since I have my backyard observatory, two years ago, I have acquired around 200 spectra of Be stars. In 2016 I discovered an outburst on QR Vul and the night of august 21st this year, I took a spectrum of V442 Andromedae and found an emission on top of the Halpha absorption line. This was a change compared to the previous spectrum in BeSS database taken end of july during the OHP spectroscopy workshop by Valérie Desnoux (fig. 1).

Fig.1: comparison august 22nd and july 31st spectra


The alert was quickly given to the BeSS community through the ARAS discussion group and the ARAS forum. The ideal observing period on ARASBeAm, a web site used by Be star amateur spectroscopists, has been lowered from 30 days to 1 day for this outburst period. As a side note, this shows the importance of always comparing the spectra acquired with the last one on BeSS database or ARASBeAm website.

The first 30 nights, 95 spectra have been acquired and archived in BeSS database by 8 observers (table 1).

Observer
Spectrograph
#Spectra
Olivier Thizy
echelle
41
Dong Li
Littrow
33
Juan Guarro Flo
echelle
12
Christian Buil
echelle
3
Olivier Garde
echelle
2
Patrick Fosanelli
Littrow
2
Valérie Desnoux
Littrow
1
Jean-Noël Terry
Littrow
1
Table 1: list of observers

Noël Richardson from University of Toledo in Canada, contacted me after the outburst announcement. His initial comments were encouraging "this seems like a rare opportunity to trace the mechanisms of how small ejections in Be stars operate to build a disk. Please keep observing!". He made some spectro-polarimetry observations of his own with a 1m telescope.


V442 And star was long considered as a B star. Bozic & Harmanec (1998) studied its photometric variations and even predicted – a first for this type of stars – a spectroscopic variation with a 430 days period. McCollum et al. (2000) reported the first emission detection on Halpha, classifying this star as part of the Be stars group.

Slechta & Skoda (2004) studied an outburst through early to august 2003 and a new outburst that started in october of the same year. Using He I 6678 absorption line, they found the star rotation period of 2,615 days

Bozic & Harmanec (2004) gave a complete status of the knowledge of this star back then. They suspected a 24-29 period and a longuer one of 630 days (instead of 430 days) for the outbursts. They determined the star characteristics: 17000K effective temperature, 5 solar masses, 11 solar radius. Rotational speed of the star is close to the break out velocity and the star inclination is around 19°, close to pole-on view.

Based on spectra archived in BeSS, Fig. 2 is showing the known state of the Halpha spectral line over the past 15 years. It seems to indicate that outburst last for 3 to 6 months with quiescence phase lasting 6 to around 21 months.

 Fig. 2: V442 And known status over the past 15 years


Fig. 3 shows the evolution of the Halpha line since the outburst discovery, one spectrum selected per day. At the beginning the V (Violet) and R (Red) peaks seem to swing back and forth but then stabilize between september 2nd and 6. Another variable phase occured between september 7th and 10th with smaller variation between 11th and 15th.


Fig. 3: daily evolution of V442 And Halpha line


Coralie Neiner, from Paris-Meudon observatory, kindly suggested to measure the intensity of the two peaks and to trace V/R and V+R over time. Each spectrum has been scaled to 1 on [6580;6590] Angstroems and a gaussian has been fit on [6558;6561] for the V peak and on [6561;6564] for the R peak. Intensity is defined as the difference between the maximum of the gaussian fit and 0.9 where the absorption level has been estimated.

Fig. 4: V/R variations after outburst discovery
(note a very good time coverage on day 29-30 with Dong Li & I)


V/R graph (Fig. 4) shows a high variability for about 11 days, then stabilizes for 6 days, variable again for 5 days, then smaller variations. Same V/R variation folded over the stellar rotation period of 2,615 days shows a fairly good fit (Fig. 5).

It seems that the material initially ejected remained close to the photosphere before moving away and a second ejection occured then.

Noël Richardson wrote some kind & encouraging comments for the team: "The quick V/R changes seem consistent with a blob ejected from the star and in orbit just above the stellar surface. This should make a very interesting project. Many thanks to you for arranging the spectroscopy and to all of the observers for their time, dedication, and enthusiasm."


Fig. 5: V/R variations folded over 2.615 days period


V+R, on the other side, shows a slower variation (Fig. 6) indicating that the V/R variation above are mainly due to non homogeneous material around the star.


Fig. 6: V+R evolutions after outburst discovery


As a conclusion, this study first highlights the interest of long term Be star spectra monitoring and the importance of BeSS database. When observers focus on an outburst in a coordinated way, there are some good quality data collected – thus the importance of ARAS group. In the particular case of V442 And, profession astronomer encouragements and kind comments helped keeping the motivation of the team for coutinuous observations.

As for the results themselves, those are preliminary and additional observations should give us more information on the potentially multiple ejections of small blob of material from this Be star star and how it moves into a keplerian disk.

It is clearly a fun projects and I hope more observers joined the team as the target will still be visible for several months now.


References:


Bertaud C, Floquet M; "Observations spectrographiques d'etoiles A a spectre particulier et a raies metalliques"; Journal des Observateurs, Vol. 50, p. 425 (1967)

Bidelman W; "spectral types of 80 early-type stars of variable radial velocity"; PASP 100, p828 (1988)

Bozic H, Harmanec P; "HD6226: a new bright B variable with occasional brightenings. Is it an unrecognized Be star?" A&A 330, p222 (1998)

Bozic H, Harmanec P, et al.; "Properties and nature of Be stars , XXII. Long-term light and spectral variations of the new bright Be star HD 6226"; A&A 416, p669 (2004)

McCollum, B. et al.; "First Detection of Hα Emission in the Bright, Variable B Star HD 6226"; American Astronomical Society, 197th AAS Meeting (2000)

Neiner, C. et al.; "The Be star spectra (BeSS) database", AJ p142 (2011)

Sigut T., Patel P.; "the correlation between Halpha emission and visual magnitude during long term variations in classical Be stars"; ApJ 765 p41 (2013)

Slechta, M., Skoda P., "an outburst detected in the spectrum of HD6226", ASS 296, p179 (2005)

mardi 12 septembre 2017

PC for the observatory

Few months ago, I changed my PC at the observatory. I run with it all my equipment including the weather station - so the PC stays up and running all the time.

As several have asked me about the model & configuration, here are some details.


The PC is a JetWay JBC375:

http://www.mini-itx.com/store/?c=100#JBC375
 

Here is the detail of my order:


Note that I initially received it with only 2GB RAM and I found it was sometimes slow with PRISM v10; with 4GB RAM it runs much smoother!

The hard drive is large for my need but I do not have to remove my old files/acquisition too often so it is convenient.

The computer comes with 4 serial ports (make sure to ask for it), it is important so I could get rid of the USB-to-Serial converter which are not very reliable.


Computer with cover on

Inside the computer (with old 2GB RAM)

Inside the computer

PC serial number


mardi 29 août 2017

Amateur Ring for Astronomical Spectroscopy

ARAS is the Amateur Ring for Astronomical Spectroscopy. I is an informal group of spectroscopists, initiated after 2003 astrophysics scholl in Oléron, France, organized by the french research CNRS. Because it was widely open to amateur astronomers, this is considered as a major pro/am meeting that basically kicked off spectroscopy.

One of the project initiated after Oleron pro/am meeting is the long term monitoring of Be stars, project led by Coralie Neiner from Paris-Meudon observatory. It led to several initiatives such as:
-creation of a web page to present potential pro/am project: ARAS main web page
-creation of a Yahoo discussion group Spectro-L to exchange about pro/am projects in spectroscopy
-kick off of the Be Star Spectra database and Be stars long term monitoring
-design and first batch through AUDE association of the Lhires III spectrograph (leading the creation of Shelyak Instrument company)
-later on creation of ARAS forum
-and ARAS database for non Be star programs (VV Cep stars, P Cygni, cataclysmic variables...)

Professional astronomers have access to equipment we, amateur astronomers, do not have access to: very large telescopes (2m to 10m class), very high resolution spectrographs (HARPS, SOPHIE: 70000 to 140000 resolving power), spectropolarimeters (NARVAL, ESPADON), interferometers, infrared spectrographs, etc...
But they usually need paperwork and long delay before having telescope time access. Because telescope time is expensive, they can't run long term survey and prefere short term results. They can't get telescope time to observe Deneb for exemple - it is not "serious" enough for the professionals! :-)

Amateur astronomers on the contrary have the advantage of beeing reactive. On nova Del 2013 for exemple, first amateur spectra was done couple of hours after the announcement.
The number of amateur astronomical spectroscopists is increasing and I would estimate the number of spectroscopist in the range of 5000-10000, but the one having a slit (or let say a more "scientifcal" spectrograph) in the range of 500-1000, and the one actually doing pro/am work with their equipment in the range of 50-100.
They are also spread over the globe (well, lot of them are in France and Europe and somehow there could be more amateurs doing pro/am spectroscopy in the US/Canada and Asia). This means that when one can't observe a specific target due to bad weather for exemple, another one may have clearer skies and could observe it.

This advantage led for exemple to more than 70000 spectra taken by amateurs (ok, echelle spectra count several times, one for each order... but hey, this is the same for professional astronomers and their number of spectra is even lower).

A good exemple of networking is on the recent outburst of V442 And. When I discovered the outburst, I uploaded the spectra on BeSS database and sent a private note to the administrators letting them know about it.
The following night, I couldn't observe but Christian Buil picked up on it and took one echelle spectrum. Then I observed several nights but on august 27th, my weather was bad and I couldn't observed. I sent a note to Joan Guarro Flo who was able to take one echelle spectrum.
This led to having at least one spectrum per night, so a good coverage of the emission line. Of course it would have be reat to have a continuous 24 hours follow up with support of North America and Asian observers; but at least we got a measurement every 24 hours.

Here is the result of the first 8 nights following the outburst discovery:


It does show that the emission is constantly changing. More observations may reveal a periodic behaviour - we will see later.

My point is that ARAS if more than a Ring... it is a Network of observers. It is an informal  community and behing the friendship that can exist (thanks to pro/am meeting every 3 years, OHP spectroscopy workshop every year, and of course my travels around the globe when I was working for Shelyak), this network leads to mutual motivation, support and collaboration.

Astronomy rocks, Spectroscopy rocks, and ARAS rocks !

dimanche 27 août 2017

Status on OBE observations for the last two years

I have done some stats since the obsevatory is up and running (july 2015), here they are.

I have observed 85 times, for a total of 411 hours. A long break occured from october 2016 to july 2017 (Losmandy Titan mount was getting too erratic to use it properly).

During those two years (removing the long break, 1.33 years actually), I have acquired 296 spectra (56% are spectra of Be stars; 18% VV Cep type stars; 8% P Cygni) for a total exposition time of 200 hours.

The telescope is then accumulating photons for spectra approximatly 50% of the total observing time meaning that 50% of time I am either doing other type of observations (I also count as observing time any public outreach activities...), or telescope is pointing, in maintenance, etc... There is obviously room for improvement there...

After the recent refurbishment, even if I still have some tracking issues (but much less) and I still have to watch what is happening, the observing efficiency was clearly on the rise.
For exemple, the night of august 26th which was just after all the adjustment of the mount, I opened the observatory for 9h15min and I acquired a total of 439min on star spectra; this leads to an efficiency ratio of 79% - not bad at all!
Also the night of august 28th was a good one and the efficiency ratio was 78% (340/435) and I can say this is a very good ratio.
The remaining is opening and closing time, data backup, pointing, centering (this can take some time), finding the right exposure time (I take a 10sec expoure and measure the signal to find the propoer exposure time to get good signal without saturating; this also takes some time).